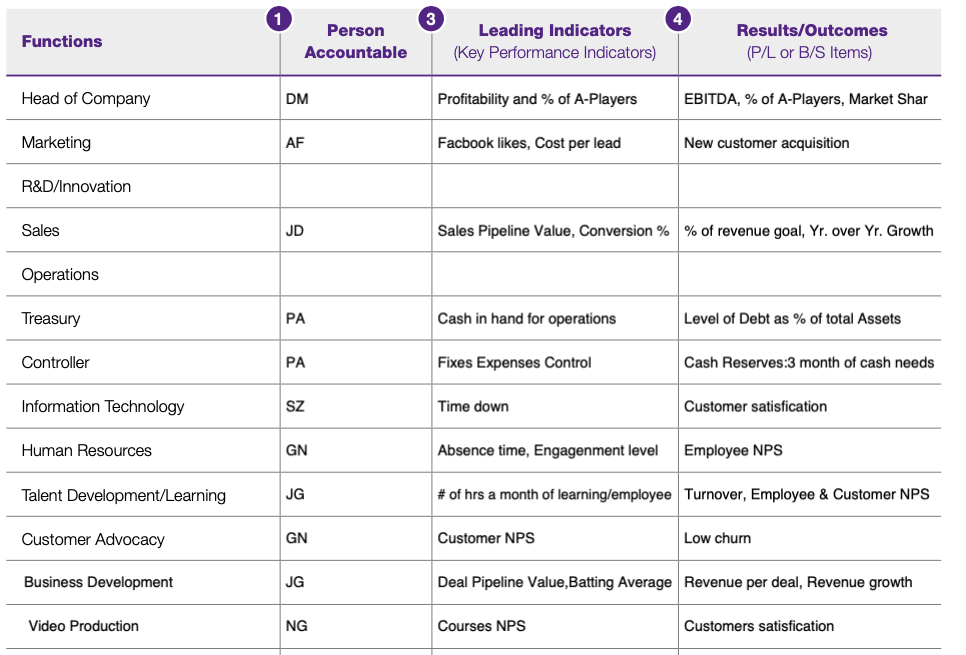
The Function Accountability Chart (FACe) is a tool that helps to outline the key roles within a company. The chart breaks down each role and their corresponding responsibilities, making it easier for companies to scale successfully. By getting clear on the roles and responsibilities of each seat in your organization, you can ensure that everyone is aware of their specific tasks and can work more efficiently as a team.
The FACe is broken down into four sections:
- Function: Outlines the specific role or function within the company.
- Person Accountable: Lists the name of the person who is responsible for that particular function.
- Leading Indicators: Outlines the key performance indicators that should be monitored in order to measure the success of that particular function.
- Results/Outcomes: Lists the desired results or outcomes that should be achieved as a result of that function.

Before we start working through this there are a couple of implementation tips that I'll share in terms of thinking through this.
Functions / Seats Are Not People
A Seat is a term borrowed from author Jim Collins. Think of the organization as a bus and each seat represents a key position in the company. The goal is to fill the bus with the right people, in the right seats. Sometimes that requires moving team members around inside the bus to find the right seats, other times we need to ask players to step off the bus.
In smaller companies it's very common for a single person to fill multiple seat, however this is not ideal. To successfully scale an organization we need to strive for one person per seat.
Seats Have Roles
Each seat has a set of roles or expectations on seats interact within the business. A best practice is to list the top 5 to 10 roles per seat. The goal isn't to detail every specific action per seat, but rather the larger roles that are critical to the healthy functioning of the company.
Leading Indicators Rather Than Lagging Indicators
These key metrics go by several different names such KPIs (key performance indicators) and OKRs (Objectives and Key Results). In this case we want to look for leading indicators, those indicators that can be acted on today which will yield a desired result later. Here's an example: New business leads is a leading indicator for new business. The same is true for customer conversion rate. If we have 100 new leads and a 10% conversion rate then we can expect the lagging indicator to be 10 new clients. Therefore if we can adjust either leading indicator upwards, we can expect to have more clients.
Results Driven
As a best practice it's desirable to have each function tie to a line item on the balance sheet or profit and loss statement. However if that's not possible then focus on lagging measures that gauge the performance of each seat. For example, HR can track the employee NPS score (eNPS) for the company on a quarterly basis. Ideally, we want metrics that are timeline and can be reviewed on the weekly or monthly basis rather than quarterly. In my experience this can take a trial and error process to dial-in effectively.
Select your template and begin.
Scaling-Up Function Accountability Chart (FACe) PDF
GMORRIS Modified FACe Google Sheet
What's with the modifications?
I prefer the flexibility and collaboration of Google Sheets. I've found that every tool in the Scaling Up Toolkit works best when it's flexed for the clients needs rather than stuck in a rigid PDF format. I've added a few new columns to make the process a bit easier to follow.

